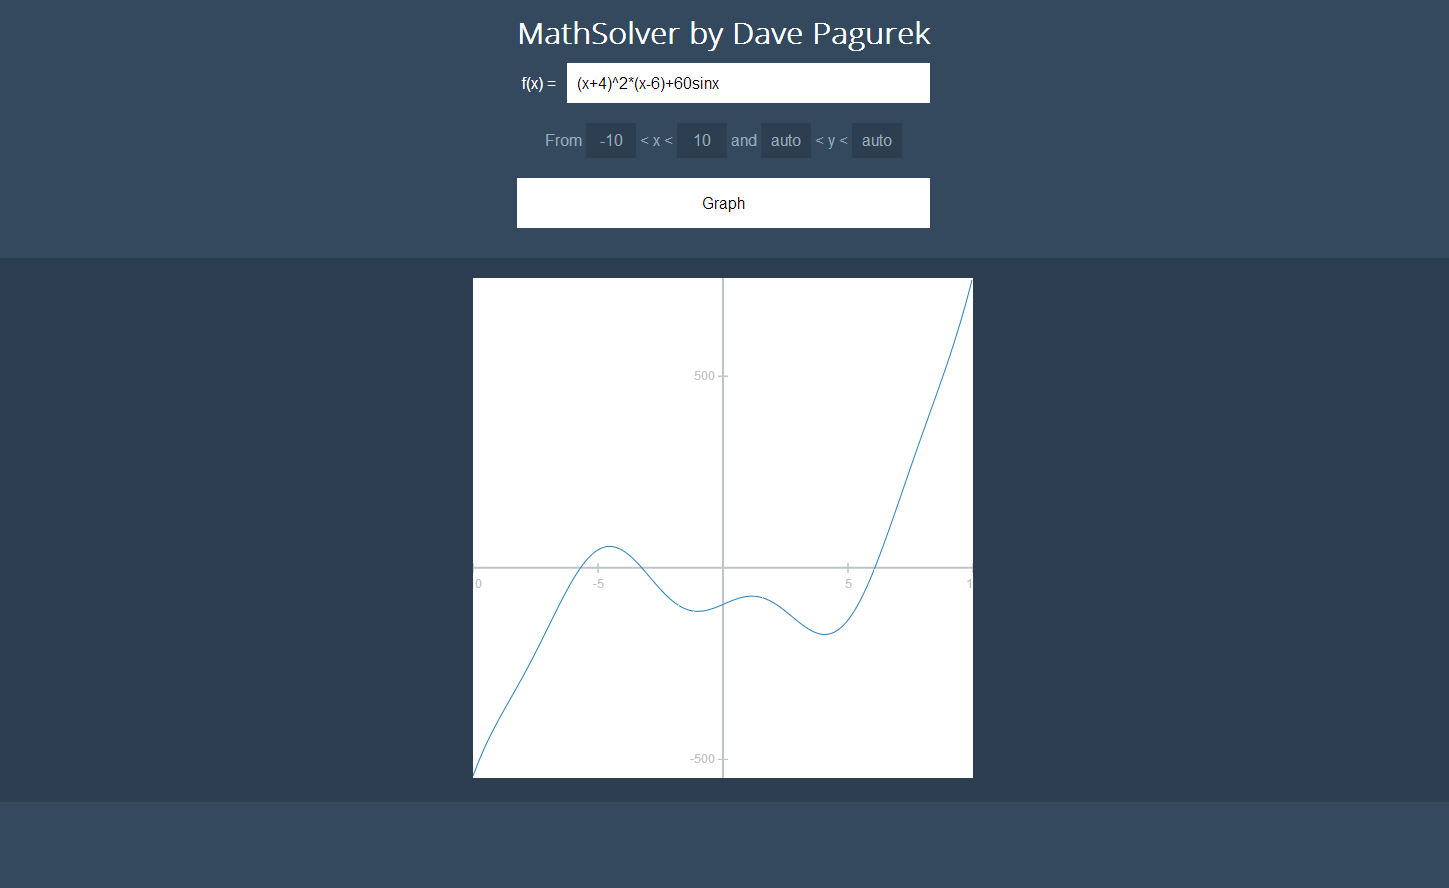
MathSolver and XCalc.js
For a little while now, I've thought it would be a fun programming exercise to build a library that reads in a string with a mathematical expression, parse that into some usable data structures, and then process it mathematically. It took me until around a month ago to think of a good way to accomplish that, but once the ball got rolling, everything fit into place nicely, and the whole thing took just a week to make.
Using XCalc.js
XCalc.js, the Javascript library I made to parse, evaluate, and graph expressions, is available for download on GitHub. Here's how to use it.
First, include XCalc.js or XCalc.min.js. The minified version is a smaller filesize, but if you want to look at the code and extend it, opt for the full, commented XCalc.js. Both files can be obtained in the releases section of the XCalc GitHub repo.
<script src="XCalc.min.js"></script>
or
<script src="XCalc.js"></script>
Expressions
Create an XCalc expression like this:
var expression = XCalc.createExpression("(10^2/(2*50))-2(30x)");
To get the result of an expression:
var x=2;
var result = expression.result(x);
If an x value is not specified, x defaults to zero.
Expressions can be derived as well:
var x=2;
var rateOfChange = expression.derive().result(x);
To get the formula of an expression as a string with HTML that can be formatted nicely (see the example CSS file):
var formulaDiv = document.createElement("div");
formulaDiv.innerHTML = expression.prettyFormula();
document.getElementById("resultDiv").appendChild(formulaDiv);
To get the formula of an expression as a plaintext string:
var formula = document.createElement("p");
formula.innerHTML = expression.formula();
document.getElementById("resultDiv").appendChild(formula);
To simplify the formula before getting it:
var formula = document.createElement("p");
formula.innerHTML = expression.simplify().formula();
document.getElementById("resultDiv").appendChild(formula);
Graphs
XCalc graphs are created like this:
var graph = XCalc.graphExpression("x^2");
To add the graph canvas to the page:
document.getElementById("result").appendChild(graph.getCanvas());
Graph functions
Constructor
A new graph is created using the following syntax:
var graph = XCalc.graphExpression(expression, width, height, x1, x2, y1, y2);
Range
Set the range of the graph with:
graph.setRange(x1, x2, y1, y2);
You can get the range of the graph with graph.getX1() or graph.getY2(), which allows you to increment the range of the graph by doing something like this:
graph.setRange(graph.getX1()+5, graph.getX2()-5, graph.getY1()+5, graph.getY2()-5); //zooms in 5px on every side
Features
Graph Features
- Dynamic scale
- Auto-range (for y axis)
- Displays coordinates on hover
- Click and drag graph to pan
- Scroll on the graph to zoom in and out
Operations Supported
As of version 1.9.3.8:
- Addition (x+y)
- Subtraction (x-y)
- Multiplication (x*y or (x)(y))
- Division (x/y)
- Exponents (x^y or x^(1/y) for roots)
- The following functions:
- sin
- cos
- tan
- asin
- acos
- atan
- abs
- log
- ln
- sqrt
- The following constants:
- e
- pi
- Single variable evaluation (include "x" in the expression string)
Algebra and Calculus
- Create the derivative of an expression
- Simplify an expression
Full documentation is available in the readme on GitHub.